In 1994, Masahiro Hara faced a problem at Denso Wave, a Toyota subsidiary. Manufacturing plants were drowning in barcodes—each component required multiple labels, scanned one at a time, with workers manually tracking which code corresponded to which part. The existing barcodes could only store about 20 characters. What they needed was something that could hold thousands of characters and be read from any angle, in under a second.
The solution Hara’s team developed became the QR code—a matrix of black and white modules that would eventually spread far beyond automotive manufacturing. By 2022, 89 million Americans were scanning QR codes on their phones. But the technical architecture that makes this possible—the Reed-Solomon error correction, the masking patterns, the carefully structured grid—remains largely invisible to the billions of people who scan them daily.
The Anatomy: Three Finder Patterns and Everything Else
A QR code isn’t a random jumble of black and white squares. Every element serves a specific purpose, and the structure follows a precise specification defined in ISO/IEC 18004.
The most visible elements are the three finder patterns—large concentric squares in the upper left, upper right, and lower left corners. These aren’t decorative. Each consists of a 7×7 module black square, surrounded by a 5×5 white square, surrounded by a 3×3 black square. The ratio 1:1:3:1:1 was deliberately chosen after Hara’s team analyzed printed matter to find the least-used pattern of alternating black and white areas. This uniqueness allows scanners to detect the QR code’s position and orientation regardless of how the camera is held.
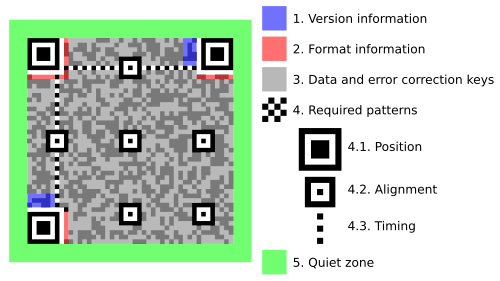
Image source: Wikimedia Commons
Between the finder patterns run timing patterns—alternating black and white modules that help the scanner determine the module size and alignment. These are particularly important for larger QR codes where distortion or perspective changes might make it difficult to count individual modules.
Near the fourth corner (lower right), alignment patterns provide additional reference points. A Version 1 QR code (21×21 modules) has no alignment patterns beyond the finder patterns. But by Version 40 (177×177 modules), there can be up to 46 alignment patterns scattered throughout the data area, each helping the scanner correct for distortion when the code is printed on curved surfaces or photographed at an angle.
Forty Versions, 177×177 Maximum
QR codes come in 40 versions, each with a different module count. Version 1 is a 21×21 grid. Each subsequent version adds 4 modules per side, so Version 2 is 25×25, Version 3 is 29×29, and so on until Version 40 reaches 177×177.
The version determines maximum data capacity, but capacity also depends on two other factors: encoding mode and error correction level. The four encoding modes optimize storage for different character types:
Numeric mode is the most efficient, using 3⅓ bits per character. Three decimal digits (000-999) are encoded into 10 bits, allowing up to 7,089 numeric characters in a Version 40 code with low error correction.
Alphanumeric mode handles digits, uppercase letters, and nine symbols ($%*+-./: and space), using 5½ bits per character—11 bits for every two characters. Maximum capacity: 4,296 characters.
Byte mode uses 8 bits per character for ISO-8859-1 encoded data, supporting up to 2,953 bytes. This is what most URLs and generic text use.
Kanji mode is a specialized encoding for Shift JIS characters from JIS X 0208, compressing each double-byte character into 13 bits. Maximum capacity: 1,817 characters.
The choice of encoding mode matters. A URL like “HTTPS://EXAMPLE.COM/PATH” would use alphanumeric mode, while “https://example.com/path" with lowercase letters must use byte mode, consuming nearly twice as many bits for the same content.
Reed-Solomon: The Mathematics of Damage Recovery
The most remarkable feature of QR codes isn’t their capacity—it’s their resilience. A QR code with Level H error correction can sustain up to 30% damage and still decode correctly. This isn’t magic; it’s mathematics.
In 1960, Irving Reed and Gustave Solomon, working at MIT’s Lincoln Laboratory, published a paper describing a new class of error-correcting codes. Their insight was to treat data as coefficients of polynomials over finite fields. By evaluating these polynomials at multiple points and storing the results, any later errors could be detected and corrected through algebraic reconstruction.
QR codes implement Reed-Solomon codes over GF(2⁸)—the Galois Field with 256 elements. Each element is a byte, and arithmetic operations are performed modulo the primitive polynomial x⁸ + x⁴ + x³ + x² + 1 (hexadecimal 0x11D). This field has special properties: addition corresponds to XOR, and multiplication follows carefully designed tables.
The error correction works by generating redundant codewords from the data. For a QR code with Level M error correction (15% recovery), the encoder takes the data bytes, treats them as polynomial coefficients, and multiplies by a generator polynomial to produce error correction bytes. If some bytes are later corrupted—by dirt, damage, or a logo placed in the center—the decoder can reconstruct them.
The number of error correction bytes determines recovery capacity. Level L provides 7% recovery with fewer redundant bytes. Level H provides 30% recovery but sacrifices data capacity—in a Version 10 code, Level L can hold 271 bytes while Level H holds only 134.
Error Correction Levels:
Level L (Low):        7% recovery
Level M (Medium):    15% recovery
Level Q (Quartile):  25% recovery
Level H (High):      30% recovery
In larger QR codes, data is split into multiple Reed-Solomon blocks that are interleaved. This prevents localized damage from overwhelming any single block’s correction capacity. A Version 40 code with Level H error correction uses 127 blocks, each with its own error correction bytes.
The Masking Problem: Avoiding Patterns That Confuse Scanners
Consider what would happen if a QR code encoded 100 zeros in numeric mode, with no further processing. The data area would contain large patches of identical modules—regions where every square was the same color. These uniform regions would confuse scanners, potentially being mistaken for timing patterns or quiet zones.
QR codes solve this through masking. After data is placed in the grid, one of eight mask patterns is applied. Masking XORs certain modules (flipping black to white and vice versa) according to specific rules:
- Mask 0:
(i + j) mod 2 = 0— checkerboard pattern - Mask 1:
i mod 2 = 0— every other row - Mask 2:
j mod 3 = 0— every third column - Mask 3:
(i + j) mod 3 = 0— diagonal pattern - Mask 4:
(floor(i/2) + floor(j/3)) mod 2 = 0 - Mask 5:
(i × j) mod 2 + (i × j) mod 3 = 0 - Mask 6:
((i × j) mod 2 + (i × j) mod 3) mod 2 = 0 - Mask 7:
((i + j) mod 2 + ((i × j) mod 3)) mod 2 = 0
The encoder tries all eight masks and selects the one with the lowest penalty score. Penalty is calculated by checking for:
- Groups of five or more same-colored modules in a row or column
- 2×2 blocks of the same color
- Patterns that resemble finder patterns (dark-light-dark-dark-dark-light-dark with four light modules on each side)
- Uneven ratio of dark to light modules
This optimization ensures the final QR code has no large uniform areas and roughly equal numbers of black and white modules, making it easier for scanners to distinguish individual modules.
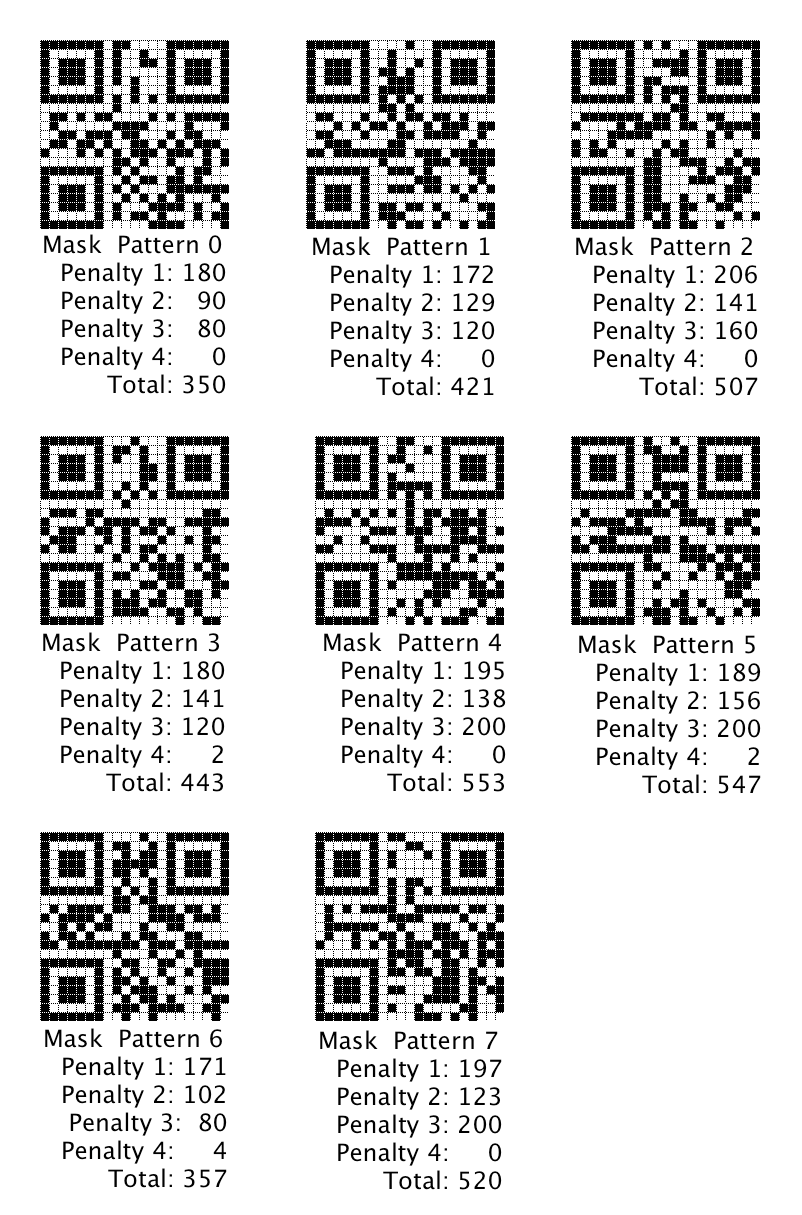
Image source: Thonky QR Code Tutorial
Format and Version Information
Two small but critical regions store metadata about the QR code itself.
Format information consists of 15 bits encoding the error correction level (2 bits) and mask pattern (3 bits), protected by 10 error correction bits using a BCH code. This information appears twice in each QR code—once near the upper left finder pattern and once near the upper right and lower left patterns—providing redundancy if one region is damaged.
Version information, present only in Version 7 and higher, uses 18 bits (6 data bits plus 12 error correction bits) to encode the QR code version. Without this, a scanner wouldn’t know how many modules to expect.
The Quiet Zone: Invisible but Essential
Every QR code is surrounded by a “quiet zone”—at least four modules of white space on all sides. This border isn’t optional; it’s required by the specification. The quiet zone helps scanners distinguish the QR code from surrounding text, images, or other codes. Without it, scanners might misidentify where the code begins or include extraneous elements in their analysis.
In practice, many QR code generators include more than the minimum four modules, creating a visible white border that ensures reliable scanning even when the code is printed near other content.
From Camera to Decoded Data
When a smartphone camera captures a QR code, the decoding process follows a precise sequence:
-
Detection: The scanner searches for finder patterns, using the 1:1:3:1:1 ratio to identify potential QR codes regardless of orientation or perspective.
-
Perspective Correction: Using the three finder patterns and any alignment patterns, the scanner calculates a transformation matrix to correct for the camera’s viewing angle, producing a rectified grid.
-
Module Sampling: The scanner samples each module position to determine whether it’s dark or light, using timing patterns to calibrate the sampling grid.
-
Format Decoding: The format information is read and error-corrected to determine the error correction level and mask pattern.
-
Unmasking: The mask pattern is applied in reverse to restore the original data modules.
-
Data Extraction: Modules are read in a zigzag pattern (right-to-left, alternating between upward and downward columns), converted to bytes, and error-corrected.
-
Decoding: The data is decoded according to the encoding mode indicator, producing the final output.
Why QR Codes Won
QR codes succeeded where other 2D barcodes didn’t because of a combination of technical and practical factors. The error correction makes them robust enough for real-world use—printed on receipts, displayed on screens, scratched on products. The open standard (Denso Wave chose not to enforce patent rights) allowed widespread adoption without licensing fees. The four encoding modes provide flexibility for different data types.
But perhaps most importantly, the design decisions Hara made in 1994—inspired, according to his account, by the black and white stones on a Go board—created a system that works reliably across a huge range of conditions. A QR code can be photographed at an angle, partially obscured, printed at different sizes, even incorporate a logo in its center, and still decode correctly.
The mathematics underneath—Reed-Solomon codes, Galois fields, masking optimization—remains invisible to users. But it’s this invisible infrastructure that makes the visible magic possible: pointing a phone at a square and having information appear, instantly, from a pattern that can survive damage, distortion, and three decades of technological change.
References
- ISO/IEC 18004:2024 - Information technology — Automatic identification and data capture techniques — QR code bar code symbology specification
- DENSO WAVE. (n.d.). History of QR Code. QRcode.com. https://www.qrcode.com/en/history/
- DENSO WAVE. (n.d.). Information capacity and versions of QR Code. QRcode.com. https://www.qrcode.com/en/about/version.html
- Reed, I. S., & Solomon, G. (1960). Polynomial Codes Over Certain Finite Fields. Journal of the Society for Industrial and Applied Mathematics, 8(2), 300-304.
- Thonky. (2023). QR Code Tutorial. https://www.thonky.com/qr-code-tutorial/
- Wikipedia. (2026). QR code. https://en.wikipedia.org/wiki/QR_code
- Masahiro Hara - Wikipedia. https://en.wikipedia.org/wiki/Masahiro_Hara
- Wikiversity. (2025). Reed–Solomon codes for coders. https://en.wikiversity.org/wiki/Reed%E2%80%93Solomon_codes_for_coders
- PBS NOVA. (2015). The Codes of Modern Life. https://www.pbs.org/wgbh/nova/article/reed-solomon-codes/
- The Open University. (n.d.). Reed-Solomon codes and error correction. https://www.open.edu/openlearn/digital-computing/exploring-communications-technology/content-section-2.2