A major e-commerce platform celebrated when their cache hit ratio hit 99.2%. Their dashboard showed beautiful green charts. Three days later, their database collapsed during a flash sale. The cache hit ratio never dropped below 98%.
What went wrong? The team optimized for the wrong metric. While their cache served 99% of requests from memory, the 1% that missed were the most expensive queries—complex aggregations, joins across multiple tables, and expensive computations. A cache hit ratio tells you how often you avoid work, not how much work you’re avoiding.
The Math That Misleads
The cache hit ratio formula is seductively simple:
$$\text{Hit Ratio} = \frac{\text{Cache Hits}}{\text{Cache Hits} + \text{Cache Misses}}$$But this equation hides critical information. Consider two scenarios:
Scenario A: 1,000 requests. 990 fetch a 1KB user profile from cache (1ms each). 10 trigger a 500ms database query. Total time: 990ms + 5000ms = 5,990ms. Hit ratio: 99%.
Scenario B: 1,000 requests. 800 fetch a 1KB user profile from cache (1ms each). 200 fetch a 50KB product catalog from cache (5ms each). Total time: 800ms + 1000ms = 1,800ms. Hit ratio: 100%.
Scenario A has a higher hit ratio but 3.3x worse performance. The metric conflates frequency with cost. A single expensive miss can outweigh thousands of cheap hits.
The Fastly engineering team documented this phenomenon in their edge caching analysis. They found that cache hit ratios could remain stable while origin traffic spiked dramatically, because the small percentage of uncached requests targeted large, bandwidth-intensive assets. Their research revealed that a single metric—global hit ratio—can hide significant performance problems at the edge.
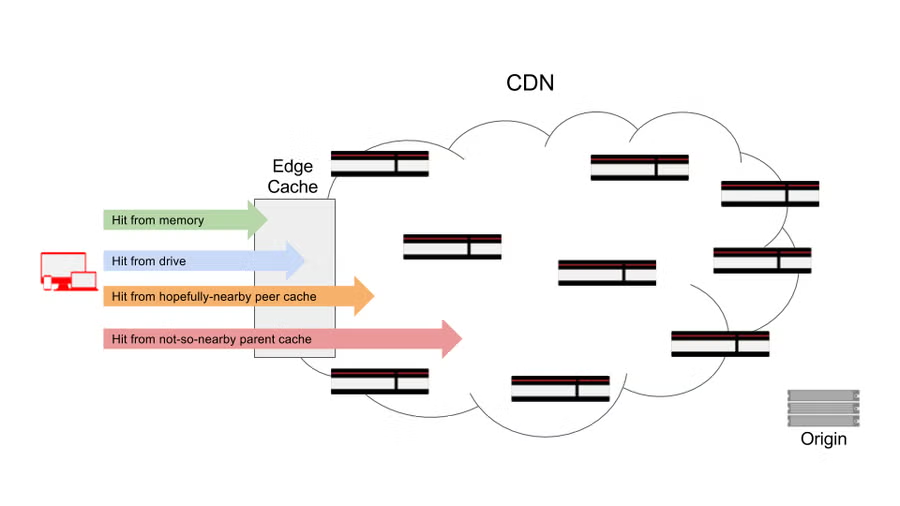
Image source: Fastly Blog - The Truth About Cache Hit Ratios
Working Set Size: The Hidden Variable
Every cache has a working set—the collection of data actively being accessed within a time window. When your working set exceeds cache capacity, eviction becomes pathological.
Peter Denning introduced the working set model in 1968, and it remains fundamental to understanding cache behavior. The working set $W(t, \tau)$ at time $t$ with window $\tau$ is the set of pages referenced in the interval $[t-\tau, t]$.
Here’s the problem: most developers never measure their working set size. They guess at cache size based on available memory, not actual access patterns. When the working set grows—perhaps due to a new feature, seasonal traffic, or viral content—the cache enters a death spiral:
- Working set exceeds cache capacity
- Eviction rate increases dramatically
- Previously cached items get evicted
- Cache hit ratio stays “reasonable” (50-70%)
- Database load increases 5-10x
- Latency spikes, timeouts cascade
Brendan Gregg’s work on working set size estimation provides practical measurement techniques. The key insight: working set size is independent of cache size. You measure it, then size your cache to accommodate it—with headroom for growth.
Tail Latency: Where 1% Becomes 100%
The P99 latency—the time within which 99% of requests complete—often tells the real story. A cache system with P50 of 2ms and P99 of 500ms is fundamentally different from one with P50 of 10ms and P99 of 15ms, even if they have identical hit ratios.
Tail latency in caching comes from several sources:
Cold misses: First-time access to data that isn’t cached. These are inevitable, but their impact depends on query cost.
Eviction cascades: When working set exceeds capacity, the cache thrashes—constantly evicting and reloading. Each eviction causes a miss, but the pattern is non-uniform. Some keys get evicted repeatedly.
Cache stampede: When a popular key expires, multiple concurrent requests attempt to regenerate it simultaneously. On September 23, 2010, this exact scenario took Facebook offline for 2.5 hours. A configuration change caused a frequently-accessed key to expire. Hundreds of thousands of requests simultaneously hit the database. The database couldn’t handle the load, started timing out. The error handler treated timeouts as invalid values and deleted the cache entry, causing more requests to hit the database. A feedback loop was born.
Facebook’s engineering team later documented that this was their worst outage in over four years, affecting users internationally. The root cause wasn’t a cache miss—it was the amplification of misses when the cache became unavailable.
The solution isn’t complicated: use a mutex or probabilistic early expiration. Before regenerating an expired key, acquire a lock. Other threads wait or serve stale data. This transforms a thundering herd into an orderly queue.
Eviction Policy Matters More Than You Think
LRU (Least Recently Used) is the default eviction policy in most caching systems. It’s simple, intuitive, and often wrong.
LRU assumes that recently accessed items will be accessed again soon. This works well for temporal locality but fails spectacularly for:
- Scan patterns: Reading through a large dataset once (like a batch job) evicts everything useful.
- Frequency bias: An item accessed 100 times an hour ago gets evicted before one accessed once a minute ago.
- Working set changes: When access patterns shift, LRU adapts slowly.
LFU (Least Frequently Used) takes the opposite approach, evicting items with the lowest access frequency. This handles frequency well but struggles with:
- New popular items: A suddenly-popular item has low frequency and gets evicted immediately.
- Old popular items: Something accessed heavily six months ago stays cached forever.
Modern systems use adaptive policies. ARC (Adaptive Replacement Cache), developed at IBM, maintains two lists—recently used and frequently used—and dynamically adjusts the balance between them. TinyLFU, used in Caffeine and other high-performance caches, combines frequency-based admission with LRU eviction, preventing unpopular items from entering the cache while protecting frequently-accessed items from one-time scans.

Image source: Wikipedia - Cache Replacement Policies
The choice of eviction policy can change hit ratios by 10-40% for the same cache size and workload. This dwarfs most other optimizations.
The Metrics That Actually Matter
If cache hit ratio is misleading, what should you measure?
Miss latency distribution: Not just average miss latency, but P50, P95, P99. This reveals whether misses are cheap lookups or expensive queries.
Eviction rate: Keys evicted per second. A high eviction rate with acceptable hit ratio indicates working set overflow.
Cache memory utilization: Not just “is the cache full,” but how much of that memory is active vs. dead weight from old entries.
Origin request rate: Requests to the backend per second, not ratio. This is what actually loads your database.
TTL distribution: What percentage of your keys have what TTLs? Too many short TTLs means constant regeneration pressure.
Key access distribution: The Zipf distribution of your keys. If 10% of keys get 90% of traffic, you might only need to cache those.
pie title Cache Key Access Distribution (Typical Web App)
    "Top 10% of keys" : 90
    "Next 20% of keys" : 8
    "Remaining 70% of keys" : 2
Cold Start: The Hidden Vulnerability
Every cache starts empty. A deployment, a restart, a failover—all create a cold cache that must warm up. During warm-up, hit ratios are meaningless. Every request hits the database.
This is when systems fail. Not during steady state with 99% hit ratios, but during the transition from cold to warm. A deployment at 2 PM on a Tuesday might be fine. The same deployment at 9 AM on Black Friday triggers a cascade.
Cache warming strategies help but have trade-offs:
- Lazy loading: Let the cache fill naturally. Simple but slow warm-up, high initial load.
- Write-through: Populate cache on writes. Always warm but adds write latency.
- Background warming: Pre-populate on startup. Fast warm-up but complex implementation and potential stale data.
The Facebook 2010 outage would have been prevented by serving stale data during regeneration. The cache had the old value. It just refused to serve it while waiting for a new one that never came.
Invalidation: The Hardest Problem
Phil Karlton famously said, “There are only two hard things in Computer Science: cache invalidation and naming things.” The joke is that invalidation is genuinely hard.
The problem: when source data changes, the cached copy becomes stale. You must either:
- Invalidate immediately: Remove the cached entry. But how do you know it changed? Your cache probably doesn’t watch the database.
- Use TTL: Let entries expire naturally. But this trades freshness for simplicity, and short TTLs increase load.
- Event-based invalidation: Publish change events that trigger cache removal. Complex but precise.
Each approach has failure modes. Event-based systems can drop messages. TTL-based systems serve stale data. Immediate invalidation requires tight coupling between cache and data source.
The consistency spectrum ranges from “probably stale” to “definitely fresh,” with performance inversely correlated. Strong consistency requires coordination—locks, consensus protocols, synchronous invalidation—which adds latency and reduces availability.
What to Do Instead
Measure comprehensively. Track hit ratio, but also track miss cost, eviction rate, tail latency, and origin load. A dashboard showing only hit ratio is lying by omission.
Size for working set, not memory budget. Measure your actual working set during peak traffic. Size your cache 2-3x larger to handle growth and variance.
Choose eviction policy deliberately. Don’t accept the default. Test LRU, LFU, and adaptive policies against your actual workload. The difference can be dramatic.
Handle stampedes. Implement probabilistic early expiration (refresh 10% of TTL before expiration) or mutex-based regeneration. Never let concurrent requests regenerate the same key.
Plan for cold starts. Test deployments and failovers during peak traffic. Know how long warm-up takes and whether your backend survives the load.
Monitor tail latency. P99 tells you about the worst user experiences. Cache behavior is reflected most clearly in the tail, not the average.
The cache hit ratio is not useless—it’s just incomplete. Like measuring fuel efficiency without knowing tank capacity, or CPU usage without knowing memory pressure, it tells part of the story while hiding the rest. The engineers who build reliable systems are those who look past the headline metric to understand what’s actually happening underneath.
References
- Denning, P. J. (1968). “The working set model for program behavior.” Communications of the ACM.
- Megiddo, N., & Modha, D. S. (2003). “ARC: A Self-Tuning, Low Overhead Replacement Cache.” FAST.
- Einziger, G., & Friedman, R. (2017). “TinyLFU: A Highly Efficient Cache Admission Policy.” ACM Transactions on Storage.
- Fastly Engineering. “The Truth About Cache Hit Ratios.” https://www.fastly.com/blog/truth-about-cache-hit-ratios
- Gregg, B. “Working Set Size Estimation.” https://www.brendangregg.com/wss.html
- Facebook Engineering. “More Details on Today’s Outage.” https://engineering.fb.com/2010/09/23/uncategorized/more-details-on-today-s-outage/
- Redis. “Why Your Cache Hit Ratio Strategy Needs an Update.” https://redis.io/blog/why-your-cache-hit-ratio-strategy-needs-an-update/
- Dan Luu. “A Decade of Major Cache Incidents at Twitter.” https://danluu.com/cache-incidents/
- AWS. “Database Caching Strategies Using Redis.” https://docs.aws.amazon.com/whitepapers/latest/database-caching-strategies-using-redis/
- Wikipedia. “Cache Replacement Policies.” https://en.wikipedia.org/wiki/Cache_replacement_policies